
|
January 2017 Homes provide shelter and refuge, but they are also most Albertan homeowners’ single largest investment. Housing represents 47% of total assets for the average Alberta family – much higher than stock market investments and pension plans combined (29%). Why is this important? Because homeownership benefits the economy as a whole, as well as individual homeowners. Let’s look at this in the context of the most recent stats on Alberta’s real estate, reported by the Canadian Real Estate Association. Investing in housing in Alberta is better than buying stocks Over the last 18 years, house price appreciation in Alberta has outpaced Toronto stock market returns. Between 1999 and 2016, with average annual residential sales of roughly 57,000, house price growth in Alberta (6.6%) outpaced yearly returns on stocks traded on the Toronto Stock Exchange (6.4%). Average residential prices up 3.1% in Alberta in January Total residential sales across the province were up 17.7% year-over-year, totalling 2,679 resale transactions in January 2016. Roughly 3.4 out of every 10 newly listed homes were sold, translating into a sales-to-new listings ratio (SNLR) of 34%. And the average residential sales price rose 3.1%, to $383,040. Increased home equity = increased net worth What’s so great about house prices being up? Rising house prices mean homeowners are building equity in their homes. Home equity represents the current market value of the house, minus any remaining mortgage payments. Equity is built over time as the homeowner pays off their mortgage and fluctuates with the market value. Rising home equity benefits homeowners individually, and the Alberta economy as a whole. By how much? More than $40 billion in 2016. 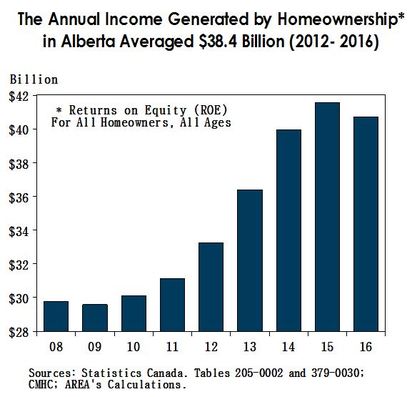 Calculating Returns to Equity Using Statistics Canada’s data on Alberta homeowners’ mortgage balances (Surveys of Financial Security), we calculated equity shares by age group. Equity shares multiplied by user costs (average two-bedroom apartment rents used as proxy) provided the income generated (returns to equity) per homeowner, by age class. The annual income generated by homeownership was then derived by multiplying the number of homeowners by age group in Alberta with returns to equity per homeowner. For those under 35, the income generated by homeownership reached $11,000 a year per homeowner Over the past five years (2012-2016), the annual income generated by homeownership averaged roughly $57,000 per homeowner (all ages) in Alberta. Returns on equity per homeowner ranged from annual income generation of $11,000 for homeowners under the age of 35 (generally considered as first-time buyers), to roughly $14,000 for those above 65 (annual average). Collectively, annual returns on equity (ROE) for all homeowners in Alberta reached roughly 38 billion dollars, or 12% of GDP Thirty-eight billion dollars a year represents roughly 12% of Alberta’s nominal GDP and 85% of Government of Alberta’s annual revenues. When people build equity in their homes, they borrow against that equity through a home equity loan, or home equity line of credit. An increase in the value of their homes increases the amount of collateral available to households, leading to higher credit. Rising house prices, which imply higher housing equity, may encourage consumers to borrow more, causing a rise in consumer spending. Looking at the data, we know this to be true. 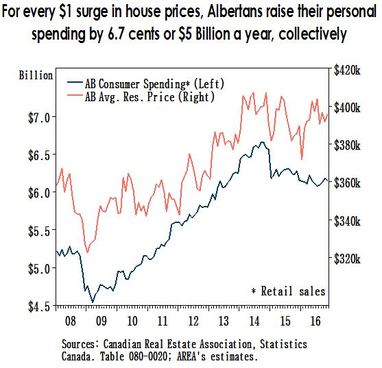 For every $1 rise in housing prices, Albertan homeowners raise their personal spending by 6.7 cents – collectively $5 billion a year
The increase in consumer spending following a rise in in house prices has been referred to as the marginal propensity to consume (MPC) from housing wealth. We found that, for every $1 increase in average residential prices, Albertans raise their personal spending by 6.7 cents, which collectively amounts to roughly $5 billion a year (2012-2016 average). Five billion dollars a year is 1.5% of provincial GDP, and 11% of government revenues. This is a significant boost to Alberta’s economy. A 3.1% price gain, like the one we just saw in Alberta this January, equals an average increase of $11,420. The associated rise in consumer spending that could come out of that is $868 per homeowner per month, or $10,415 per homeowner per year, or a collective increase of $616 million a year. Provided by Alberta Real Estate Association-2017 Market Report
1 Comment
Feb 1, 2017 crebnow Calgary Real Estate News
January market improves over last year At 4,112 total units, January’s inventory was 18 per cent below last year’s levels, according to CREB®, which released its monthly housing summary today. “While housing conditions continue to favour buyers, a slow transition toward more balanced conditions is helping to ease downward pressure on home prices,” said CREB® chief economist Ann-Marie Lurie. “Conditions have improved over last year, but people need to remember that last year’s market was one of the weakest on record. Despite the appearance of a major shift in activity, the transition in the housing market is going to be a slow process.” January sales totaled 947 units, 24 per cent above last year, but 21 per cent below 10-year averages for the month. Sales activity improved across all product types, but only when compared to the near record lows that occurred in January 2016. The detached segment of the market is demonstrating the most improvement. Sales activity totalled 584 units in January, a considerable improvement over the 466 sales recorded last year. Inventories have also declined pushing the months of supply to 3.2 months well below the 5.4 months recorded in January 2016. “This past month showed how the market never stands still,” said CREB® president David P. Brown. “The market isn’t expected to be as unpredictable in 2017, but it’s early in the year and there are still lots of unknowns that will shape decision-making for consumers.” “Every transaction is a personal decision and anyone going through the process of buying and selling real estate will be trying to make the best decision for their family. They need to consider their long-term objectives and think about the price they are willing to accept or pay for a home.” City-wide benchmark prices totaled $437,400, 0.16 per cent lower than last month and 2.82 per cent lower than last year’s levels. Since recent highs in 2014, residential prices have declined from a low of 4.9 per cent in the detached sector to highs of 11.5 per cent in the apartment condominium market. Click here to view the full City of Calgary monthly stats package. Click here to view the full Calgary region monthly stats package. |
Evolve's BlogA place for us to share market news and information and chat about real estate related topics Archives
February 2021
Categories |
 RSS Feed

|
The trademarks REALTOR®, MLS®, Multiple Listing Service® and the associated logos are owned by The Canadian Real Estate Association (CREA) and identify the quality of services provided by real estate professionals who are members of CREA. Used under license Data supplied by CREB® MLS® System. CREB® is the owner of the copyright in its MLS® System. The Listing data is deemed reliable but is not guaranteed accurate by CREB®.
Copyright © 2014 Evolve Realty Inc. All Rights Reserved. |